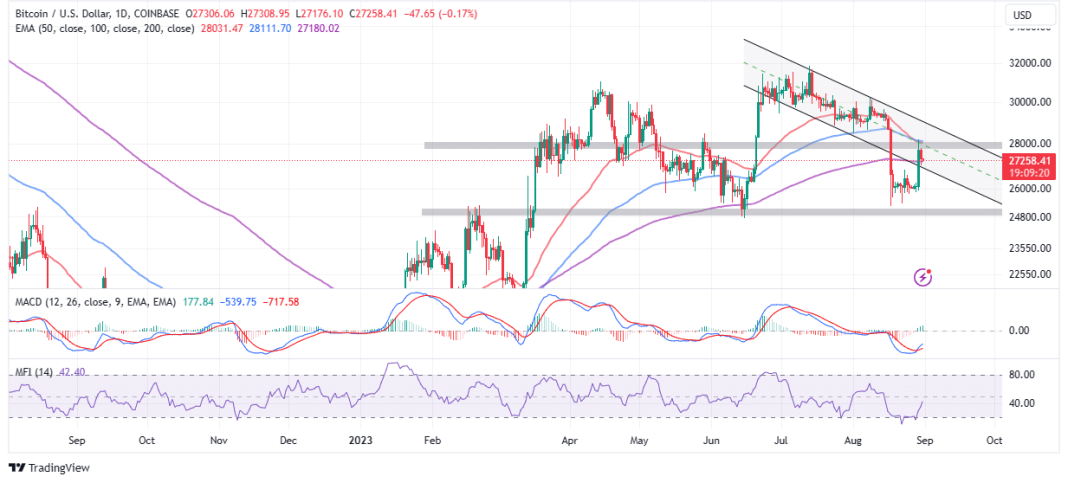
Bitcoin’s surprise rebound to $28,000 has convinced analysts in the market that the sell-off is almost over and a recovery into the bull market is in the initial stages. This rally, although brief, changed the technical aspect of BTC price, lowering the chances of another dip below $25,000 support/resistance.
The most prominent crypto saw a spike in trading volume as investors quickly reacted to the much-publicized Grayscale Investments’ win against the Securities and Exchange Commission (SEC).
The ruling made by the appeals court permits Grayscale to convert its Bitcoin Trust (GBTC) product to a spot Bitcoin exchange-traded fund (ETF) upon approval by the SEC.
Many analysts, opinion leaders, and experts in the crypto industry believe that the approval of a spot BTC ETF and the upcoming halving would fuel the next bull run anticipated in 2024/2025.
However, the SEC has continued to reject proposals citing volatility and possible market manipulation among other reasons for not giving the greenlight.
Has BTC Price Exhausted The Downtrend?
A research paper by JPMorgan Chase & Co., cited by Bloomberg, reckons that the longstanding crypto winter is almost over. According to the researchers, liquidations of long positions, especially in Bitcoin are “largely behind us.”
Based on indicators like the open interest in CME Bitcoin futures contracts, which according to a written statement from analyst Nikolaos Panigirtzoglou has gone down significantly hinting at the downtrend losing strength.
As a result, we see limited downside for crypto markets over the near term,” the report said.
BTC price, down 0.8% toward the end of the Asian business hours on Thursday, is trading at $27,206. The 200-day Exponential Moving Average (EMA) (purple) serves as the immediate support at $27,179.
Bitcoin must stay above $27,000 as this position assures investors of the possibility of the downtrend carrying on above $30,000. This support also decreases the probability of another sell-off below $25,000.

A buy signal from the Moving Average Convergence Divergence (MACD) indicator validates the enhanced bullish outlook. As the MACD line in blue flipped above the signal line in red, the path with the least resistance turned toward $30,000.
Traders would be confident to keep their long positions intact and active as long as this momentum indicator upholds the uptrend to the man line (0.00) and into the positive area.
The Money Flow Index (MFI) reinforces the bullish grip as it lifts toward the overbought region. This shows that the inflow of funds into BTC markets outweighs the outflow volume. In other words, investors are more interested in seeking exposure to Bitcoin as opposed to selling in favor of other digital or traditional assets.
A break above $28,000 and the upper boundary of the descending channel could mark the beginning of the rally above $30,000.
Related Articles
The presented content may include the personal opinion of the author and is subject to market condition. Do your market research before investing in cryptocurrencies. The author or the publication does not hold any responsibility for your personal financial loss.


