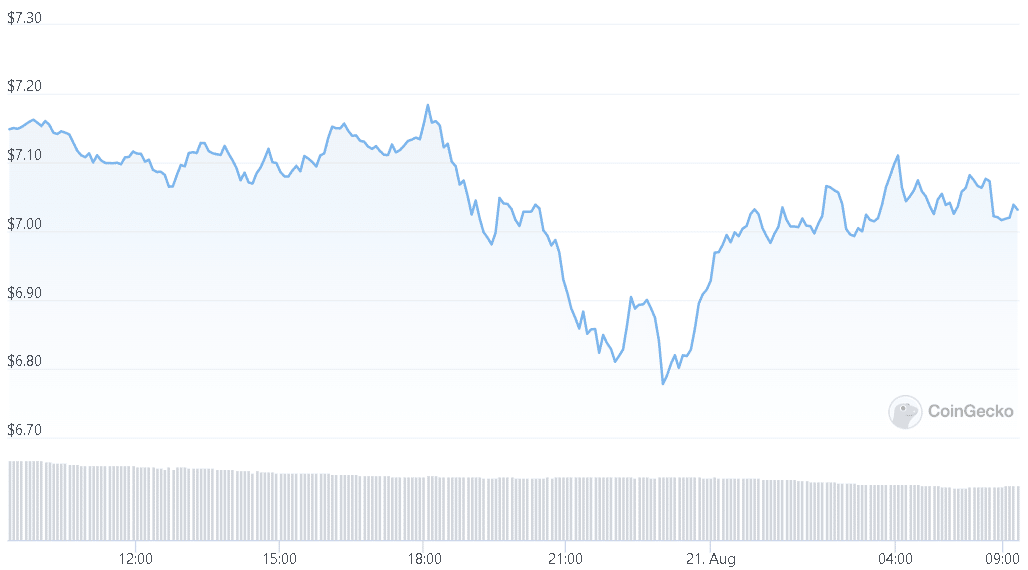
Uniswap price consolidates at $7, as it showed very little movement in the past 24 hours, with the crypto registering a 0.8% negative trend on its price chart.
Uniswap Price Consolidates At $7
UNI was trading at $7 and was unable to break over its nearest price ceiling. If the coin fails to break through the resistance level, it may lose its support line.
The technical prognosis for the Uniswap price showed that it might continue to fall on the chart. As buyers have left the market, moving over the resistance level will be challenging. Increased selling pressure has the potential to push the Uniswap price to the next support level.
Bitcoin’s price has also dropped significantly in the previous 24 hours. The currency sank to $21,000, and the altcoins followed suit. Because of broader market weakness, the Uniswap price has remained at its present level. The worldwide cryptocurrency market cap is at $1.07 trillion, down 1.0% in the previous 24 hours.

Uniswap Price Analysis
At the time this article was written, UNI was worth $7.01. The coin’s overhead resistance stood at $7.57. The Uniswap price has been unable to break over the price ceiling, resulting in selling pressure on the currency.
A drop from the current price level will instantly drive the Uniswap price to $6.90; if the coin cannot maintain its position above the aforementioned level, the next price level is $5.99. The amount of Uniswap traded in the previous session decreased, indicating that the market was under heavy selling pressure.
Technical Analysis
On the four-hour chart, UNI was moving laterally, which increased selling pressure. It was also an indicator that a drop in the chart was on the way.
The Relative Strength Index was in the oversold zone, but the coin has risen in the previous 24 hours.
On the four-hour chart, sellers were much higher than buyers despite the rise. The Uniswap price was below the 20-SMA line, indicating that sellers were driving the market’s price momentum.
Lateral activity in UNI has driven the price close to its immediate support level. The surge of sellers caused technical indicators to indicate a sell signal, but the currency has just begun to capture a buy signal.
The Moving Average Convergence Divergence indicator displays price momentum and reversal. MACD performed a bullish crossing with green histograms on the half-line, indicating a buy signal for the coin.
Bollinger Bands can help comprehend market volatility and the possibility of price change. Bands were wide open and parallel, indicating that price might go up or down in future trading sessions.
Read the latest crypto news.
DC Forecasts is a leader in many crypto news categories, striving for the highest journalistic standards and abiding by a strict set of editorial policies. If you are interested to offer your expertise or contribute to our news website, feel free to contact us at [email protected]


