Este artículo también está disponible en español.
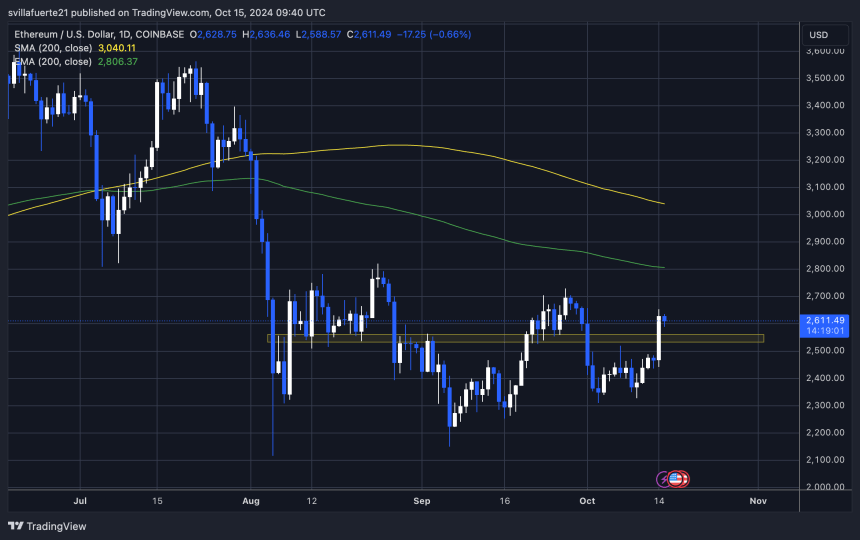
Ethereum (ETH) has surged above $2,500, now testing a critical supply level that could spark a massive rally for both ETH and altcoins.
After several days of anxiety and uncertainty, yesterday’s market surge has reignited optimism across the crypto space. Investors and traders are closely watching Ethereum’s price action, as a break above this crucial zone could signal the start of a significant upward trend, potentially setting the stage for an Altseason.
Related Reading
Top analysts and investors await confirmation that ETH is poised to rally soon. Carl Runefelt, a well-known analyst and investor, has shared his technical analysis on Ethereum, suggesting that the long-awaited rally may be just around the corner.
According to Runefelt, ETH’s breakout from the current supply zone could lead to a substantial price surge, attracting bullish momentum for Ethereum and a broader range of altcoins.
The next few days are critical for Ethereum’s price action as the market awaits signals that could define the direction of this potential rally. Investors remain optimistic, anticipating that ETH could lead the market into its next major bullish phase.
Ethereum Testing Crucial Supply
Ethereum has been trading within a bullish triangle formation since early August, and the moment of truth for a potential breakout may be close.
ETH has underperformed BTC throughout the year, causing many investors and traders to question ETH’s strength during this cycle. This trend led to a shift in confidence as Bitcoin continued to dominate, leaving Ethereum behind.
However, during yesterday’s market pump, Ethereum showed renewed strength, outperforming Bitcoin for the first time in a while, signaling a possible shift in market dynamics.
Prominent crypto analyst Carl Runefelt recently shared a technical analysis on X, highlighting Ethereum’s imminent breakout from the bullish triangle pattern.

According to Runefelt, Ethereum is approaching a key moment, and a breakout from this pattern could lead to a major rally. He suggests that once ETH breaks through, the next supply zone to target is around $3,400, representing a significant upward move from current levels.
Related Reading
This optimistic outlook comes from renewed positive sentiment across the market and Ethereum’s improved price action. Traders and investors are closely watching the next few days, as a successful breakout could mark the beginning of Ethereum’s long-awaited bullish trend and re-establish its strength relative to Bitcoin.
ETH Technical Levels To Watch
Ethereum is trading at $2,611 after a notable 7% surge yesterday. This upward momentum allowed the price to break past the $2,500 mark, a critical resistance level pushing the price down since the beginning of October.
Now, Ethereum is less than 8% away from the 200-day exponential moving average (EMA), currently at $2,806.

For bulls to gain control and establish a sustained uptrend, ETH must reclaim this 200-day EMA and close above the $2,800 level. Doing so would signal a continuation of bullish momentum and set the stage for a potential rally to higher price levels.
On the other hand, if Ethereum fails to hold above the $2,500 support level, a deeper correction may be on the horizon. In that case, the price could return to $2,300, where stronger demand may help stabilize the market.
Related Reading
The next few days are crucial for Ethereum, as traders and investors are watching closely to see whether the price can hold its recent gains and break through key resistance levels.
Featured image from Dall-E, chart from TradingView

