- The crypto market spent the greater part of last week trading consistently lower.
- Yearly profit-taking is a major reason for price declines as institutions close positions for the year, although the Fed’s hawkish stance at the Dec. 18 policy meeting also played a role.
- Open Interest in major cryptos showed weekly declines.
Bitcoin
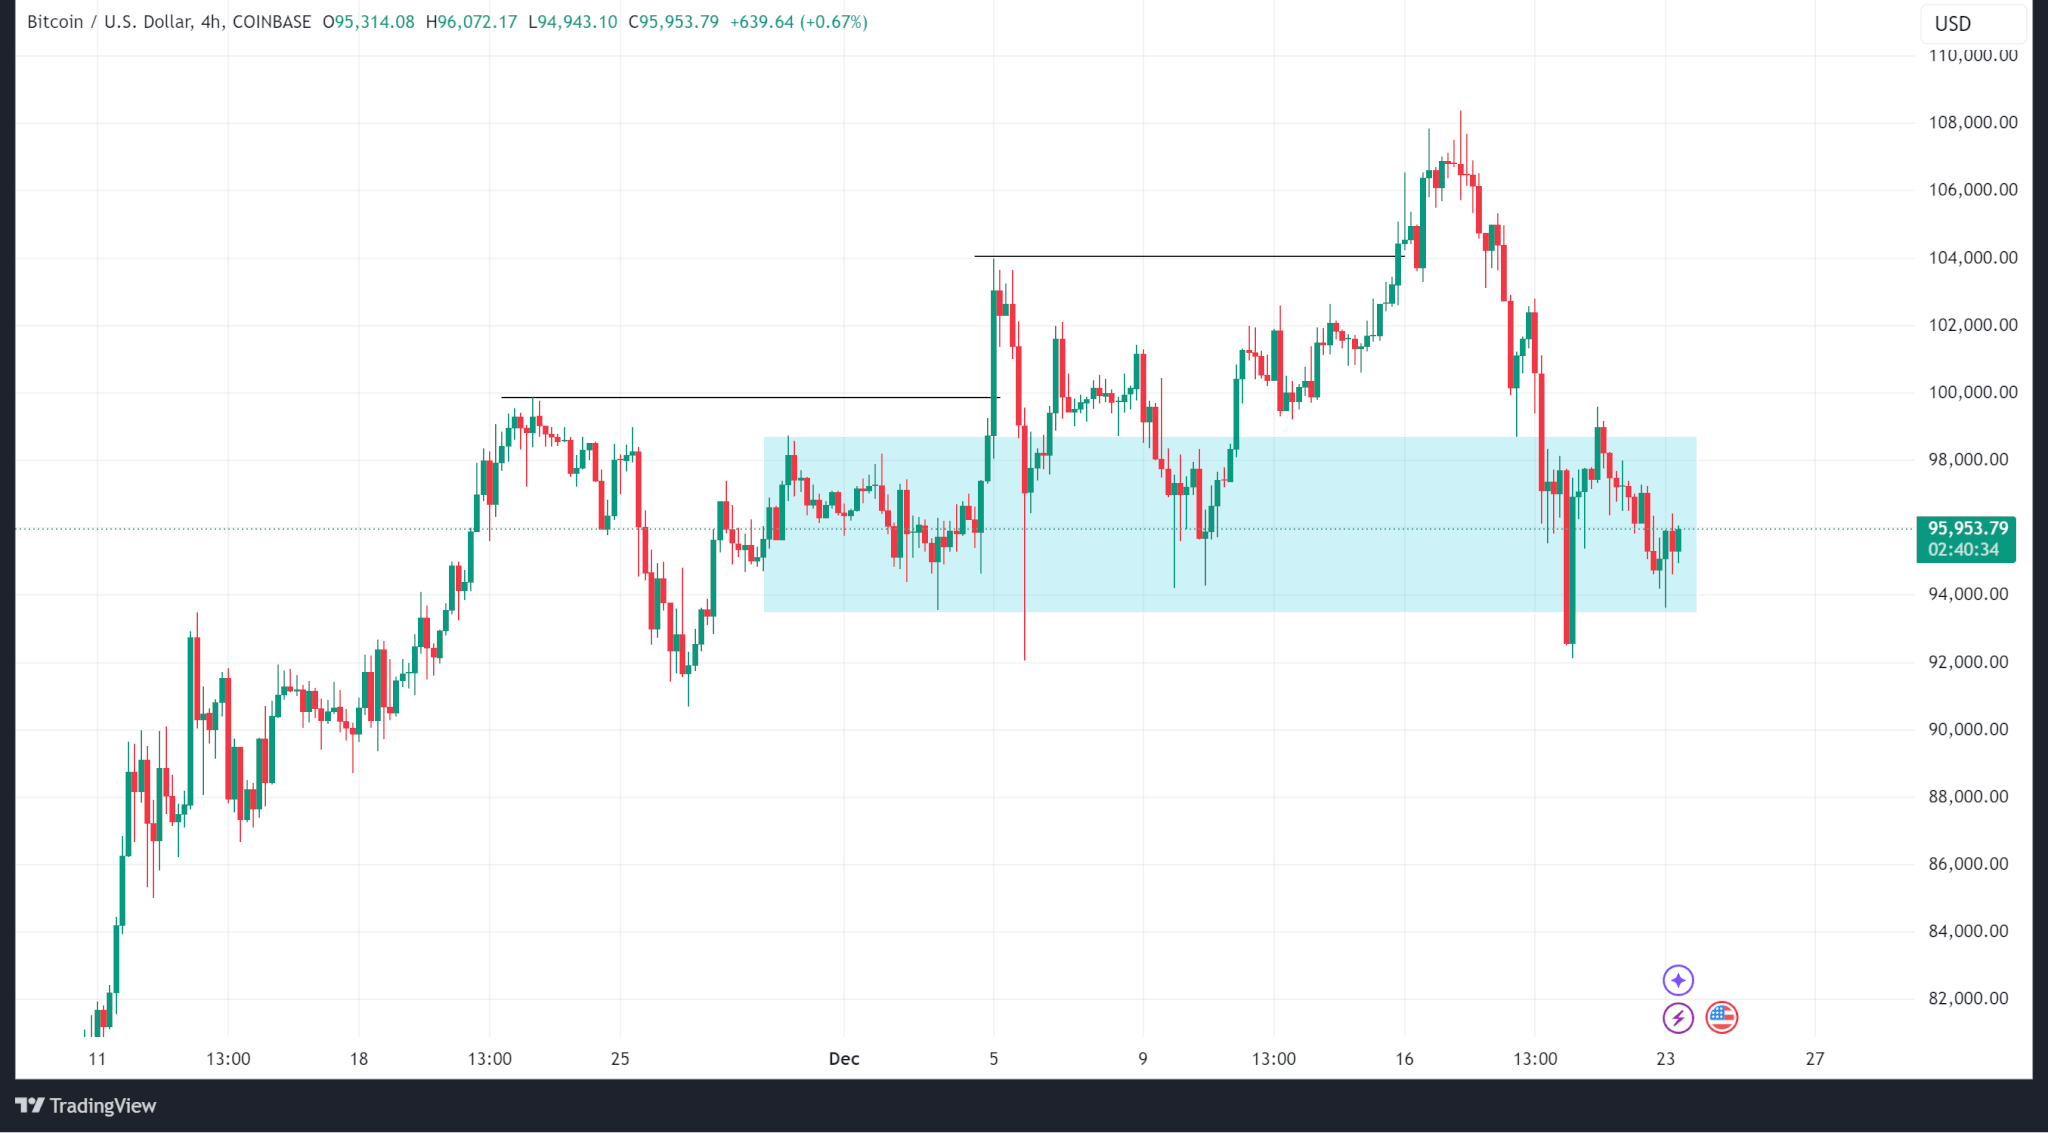
Bitcoin’s price fell from the weekly high of $108,372 on Dec. 17 to a low of $92,555 before closing the week around $97,700. However, despite the 9.7% drop, Bitcoin’s price has not changed character to the downside.
Open Interest data shows a reduction in open contracts at the CME which correlates with price declines.
The Fed’s policy decision on Dec. 18 favoured a 25bps slash. However, Fed Chair Jerome Powell expressed hawkish sentiments concerning slashing plans next year, exacerbating selloffs.
Meanwhile, Bitcoin spot ETF inflows data shows outflows on Dec. 19 and 20 totalling $948.90Mn. Net inflows from Dec. 16 to Dec. 20 were $447.00Mn.
Bitcoin trades at $95,700 as of publishing.
Ethereum
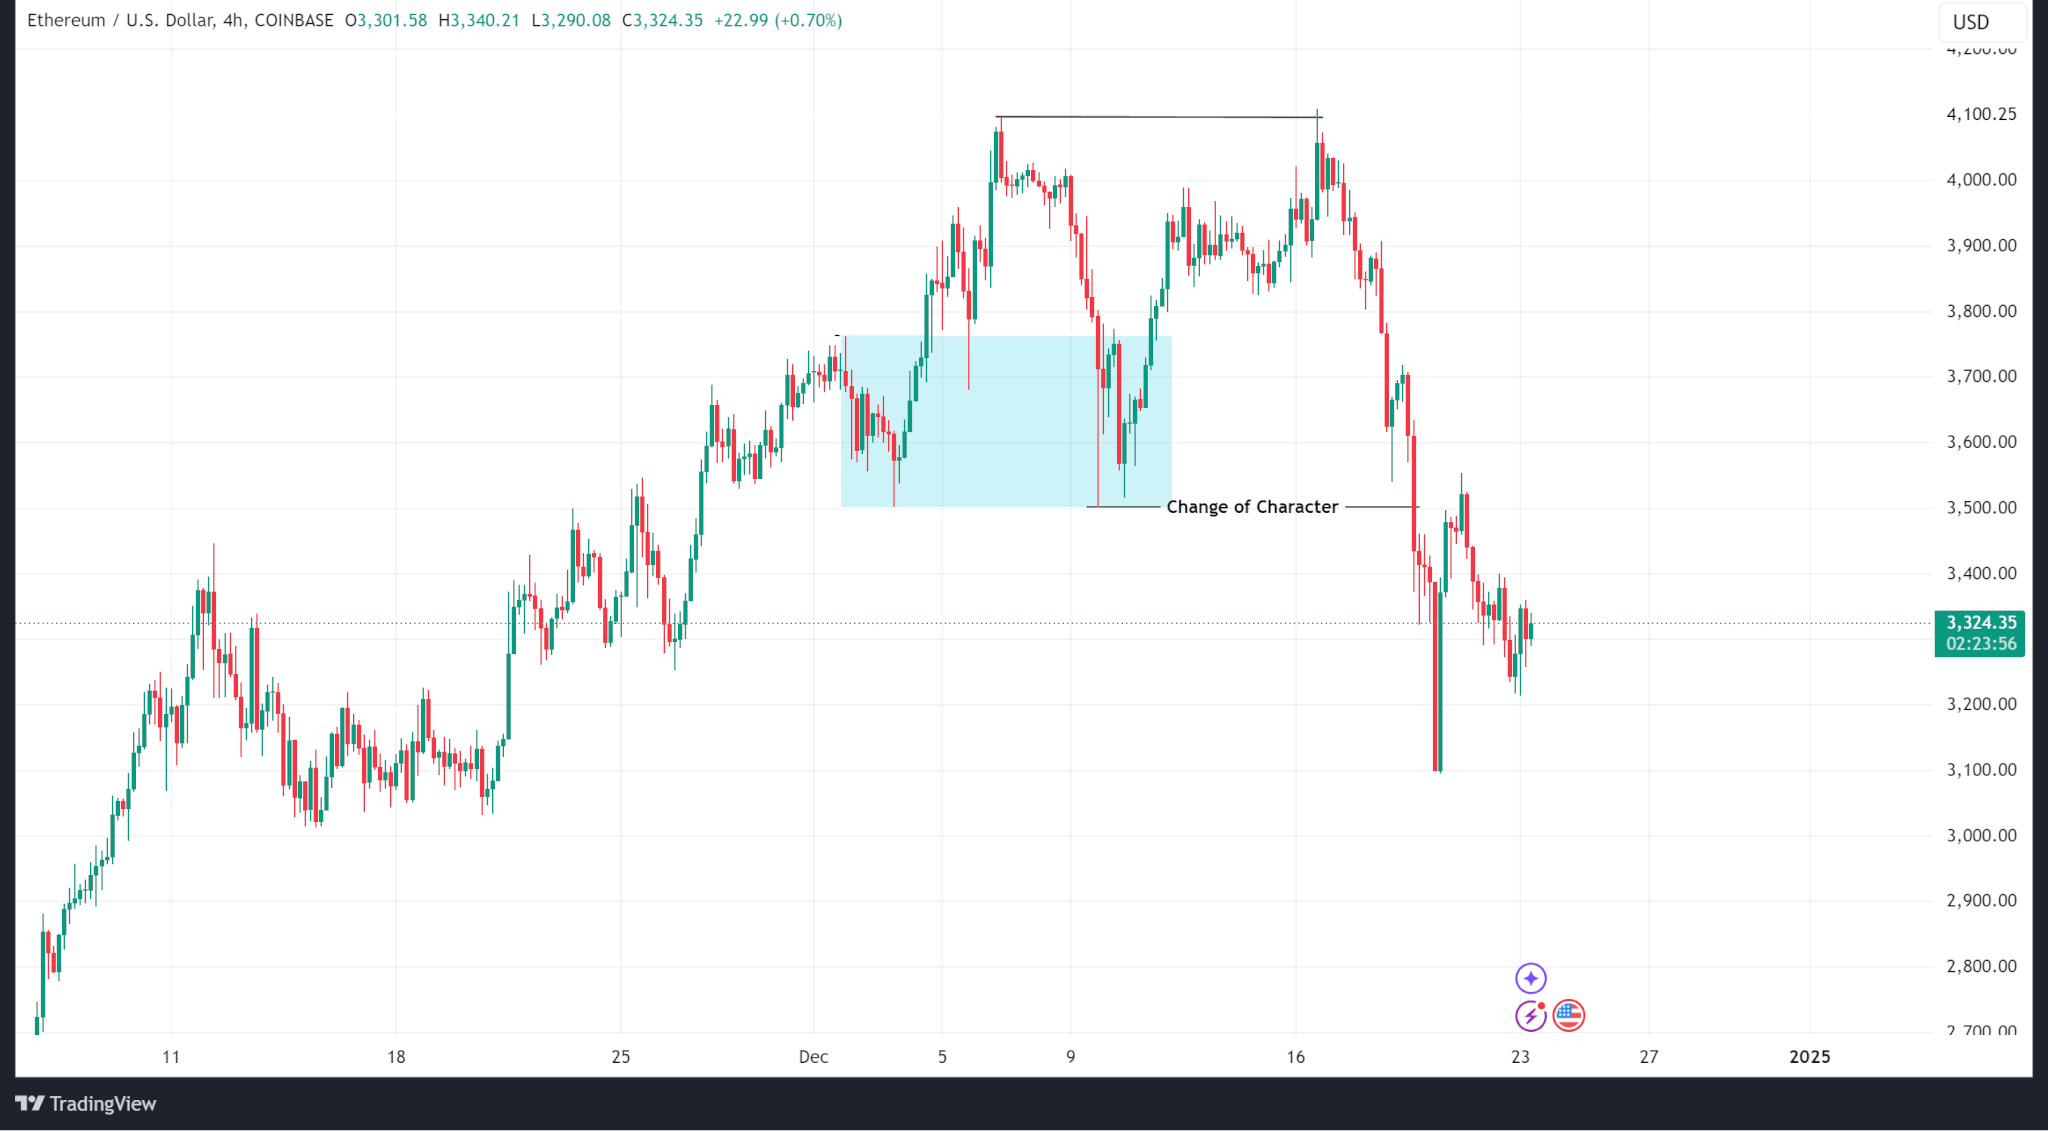
Unlike Bitcoin which maintained its bullish structure, Ethereum’s price changed character on the H4 time frame to trend lower after testing (but failing to break) the local high at $4,096.50.
Ethereum fell from a weekly high of $4,108.82 to a weekly low of $3,098.40 before eventually closing the week at $3,470.44 (a 15.51% drop).
Ethereum spot ETF inflows show a similar pattern with Bitcoin’s with outflows on the last two days of the week.
Meanwhile, Ethereum’s open interest shows a steep decline correlated with price.
Ethereum trades at $3,330.78 as of publishing.
Solana
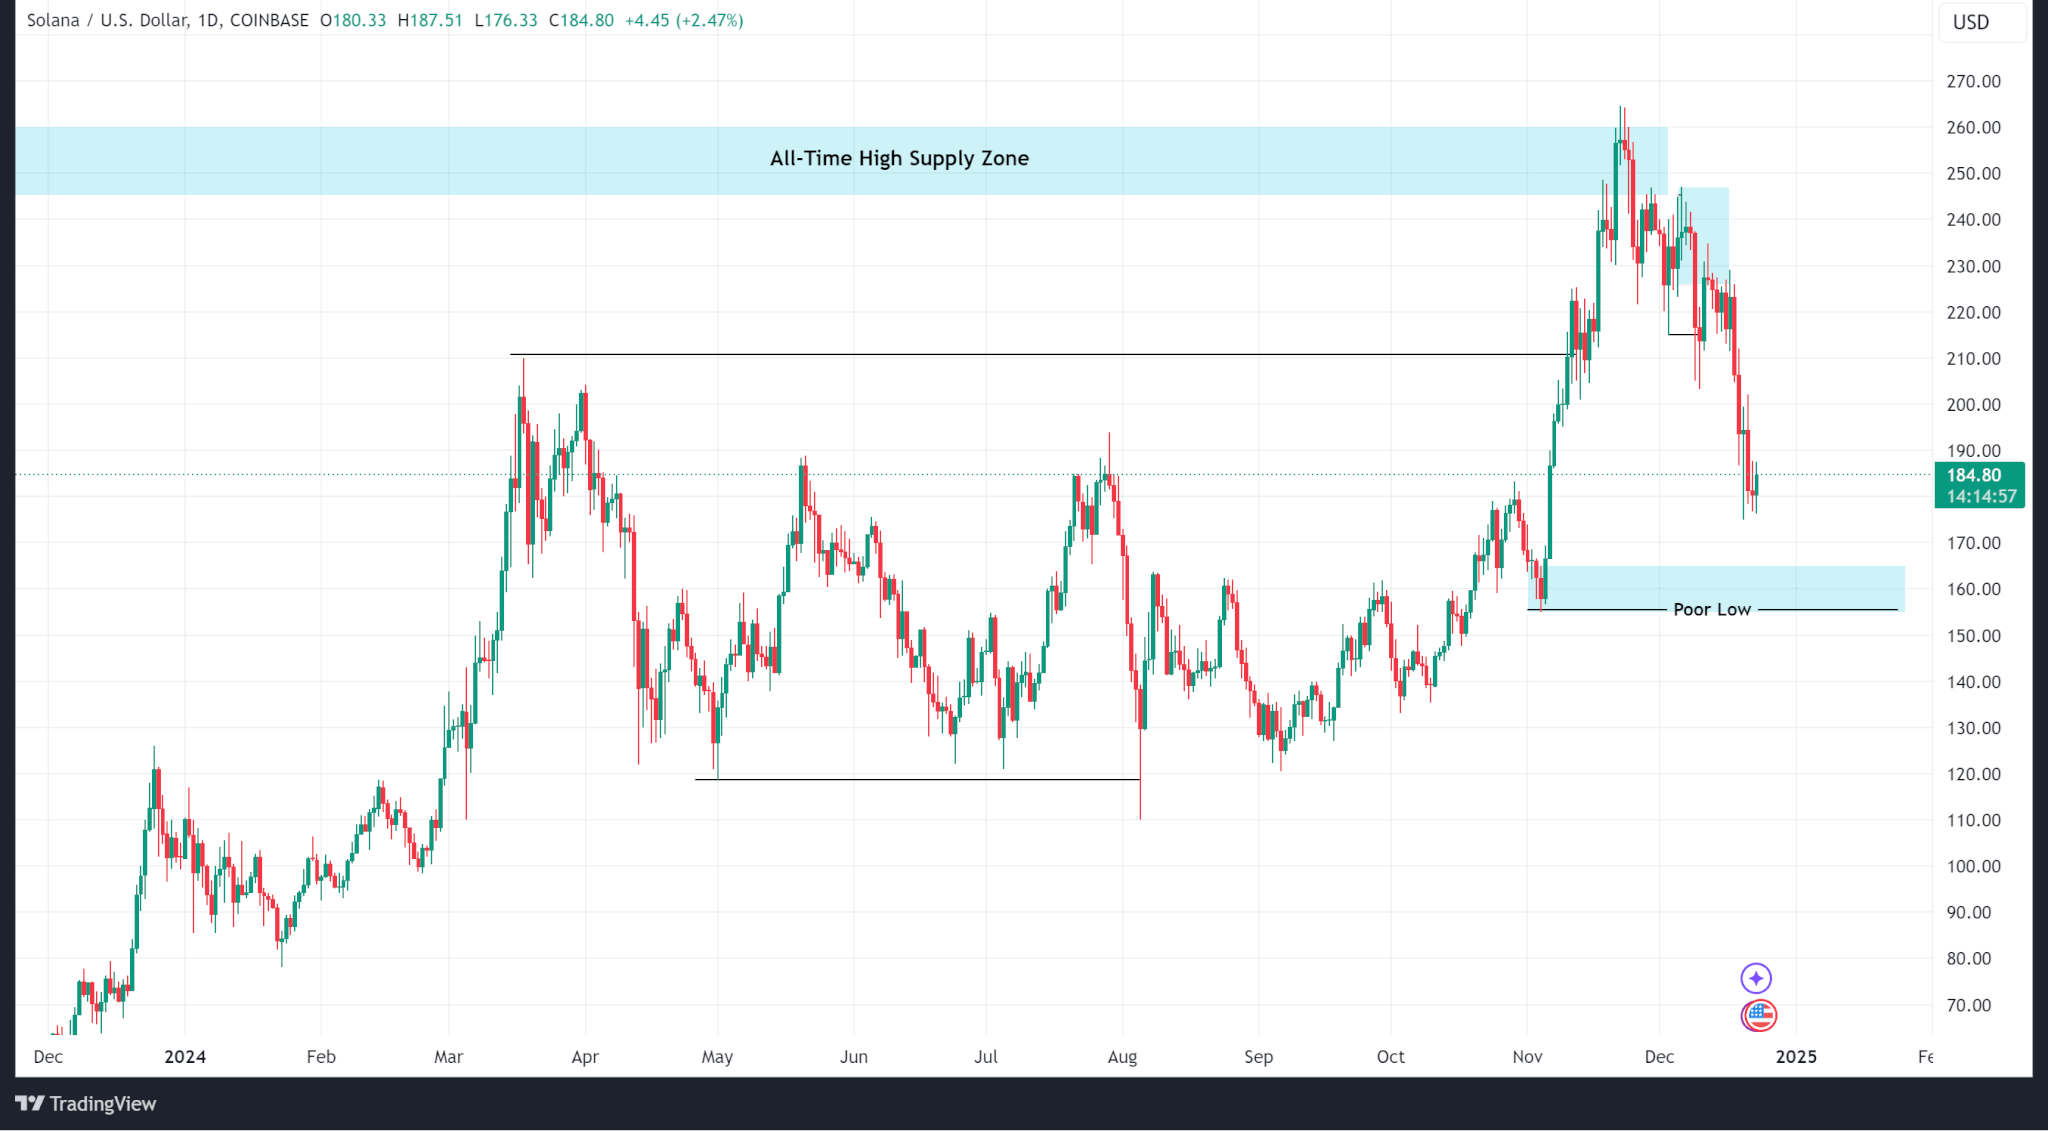
Solana’s price action continued a decline that began two weeks ago after it failed to break above the all-time high of $260.02.
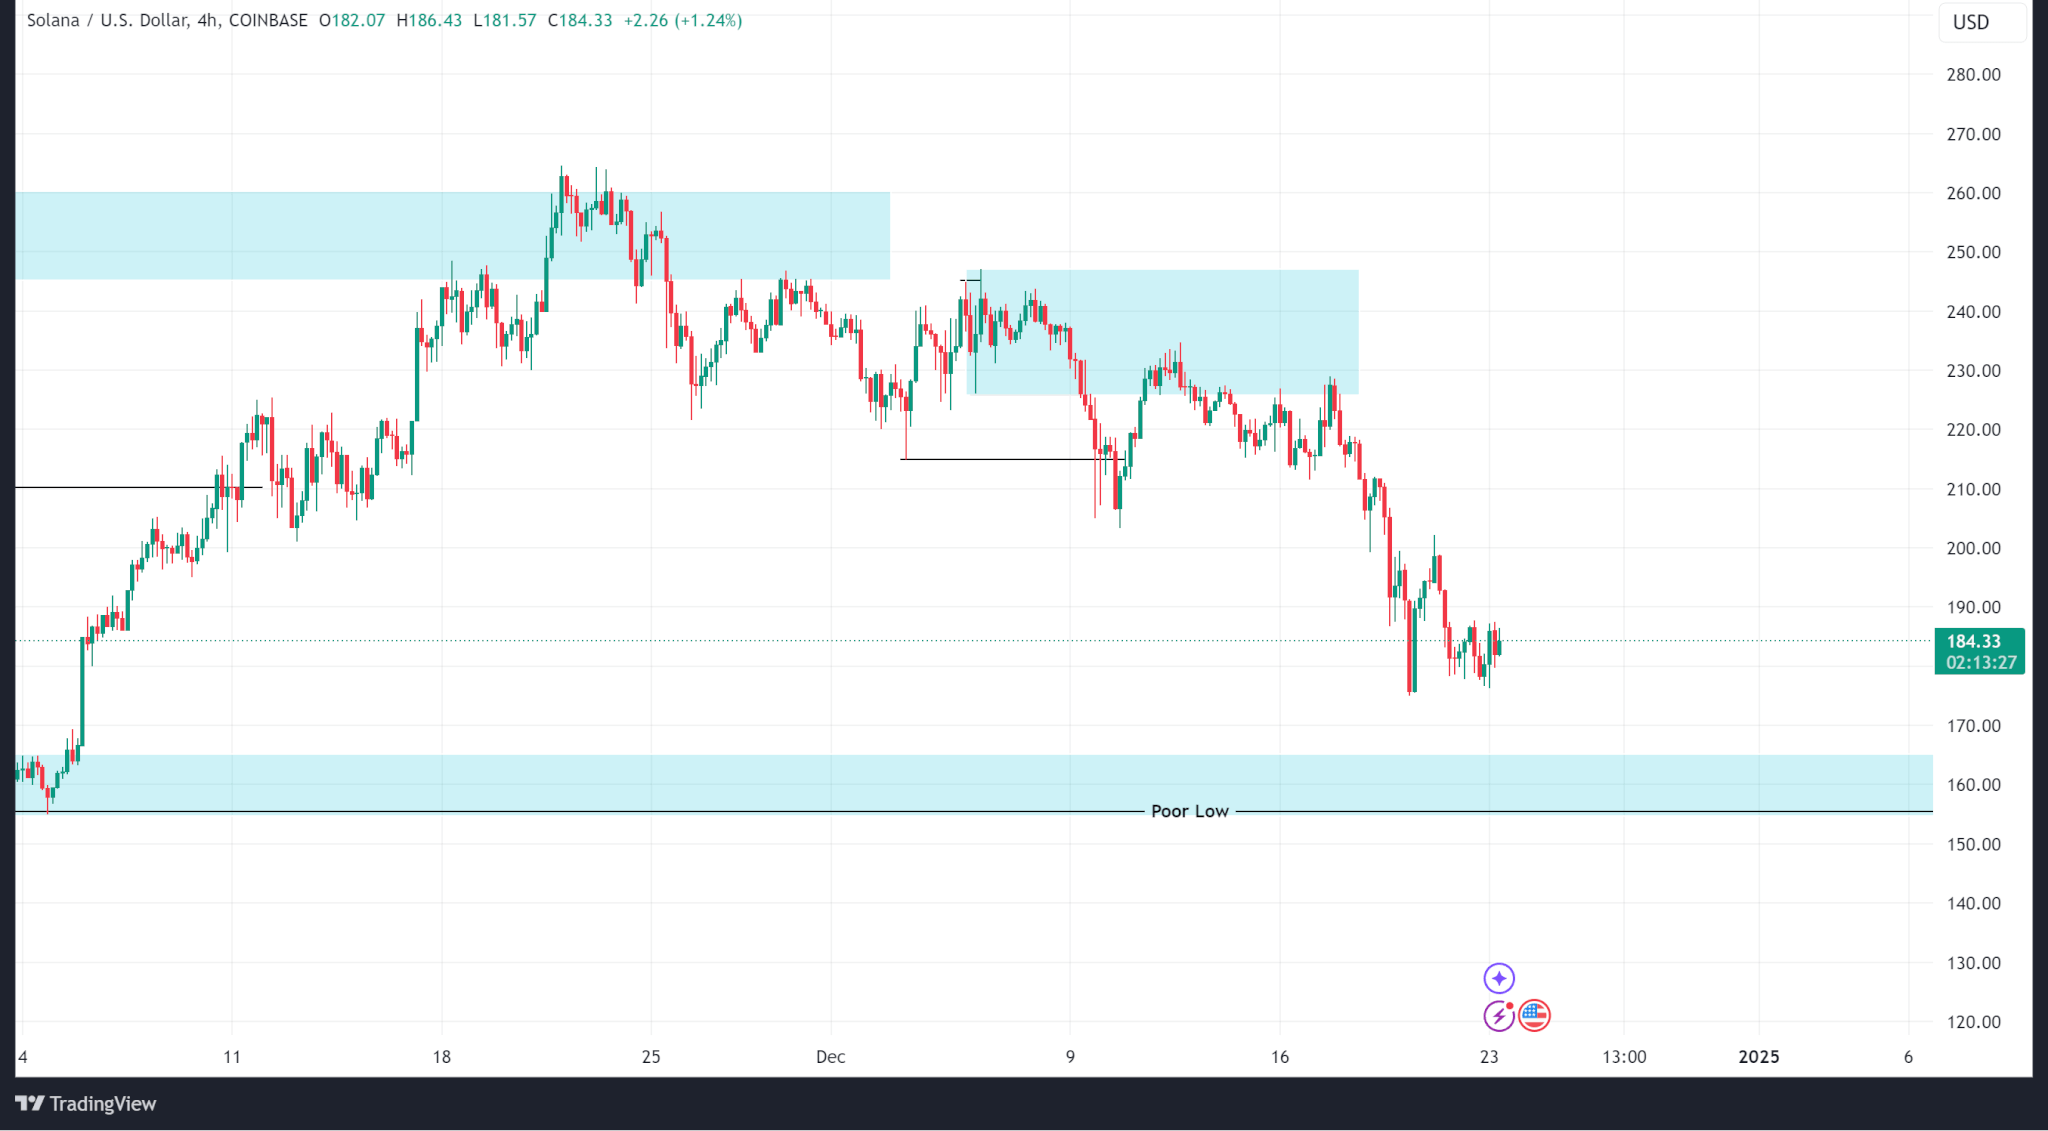
Last week, price action traded into an internal supply zone around $227.71, continued selling to a weekly low of $175.12 and eventually closed at $194.44 (a 15.07% drop).
The demand zone around $160 (mentioned last week) remains the first logical support zone as open interest continues to fall.
Solana trades at $184.82 as of publishing.
Ripple
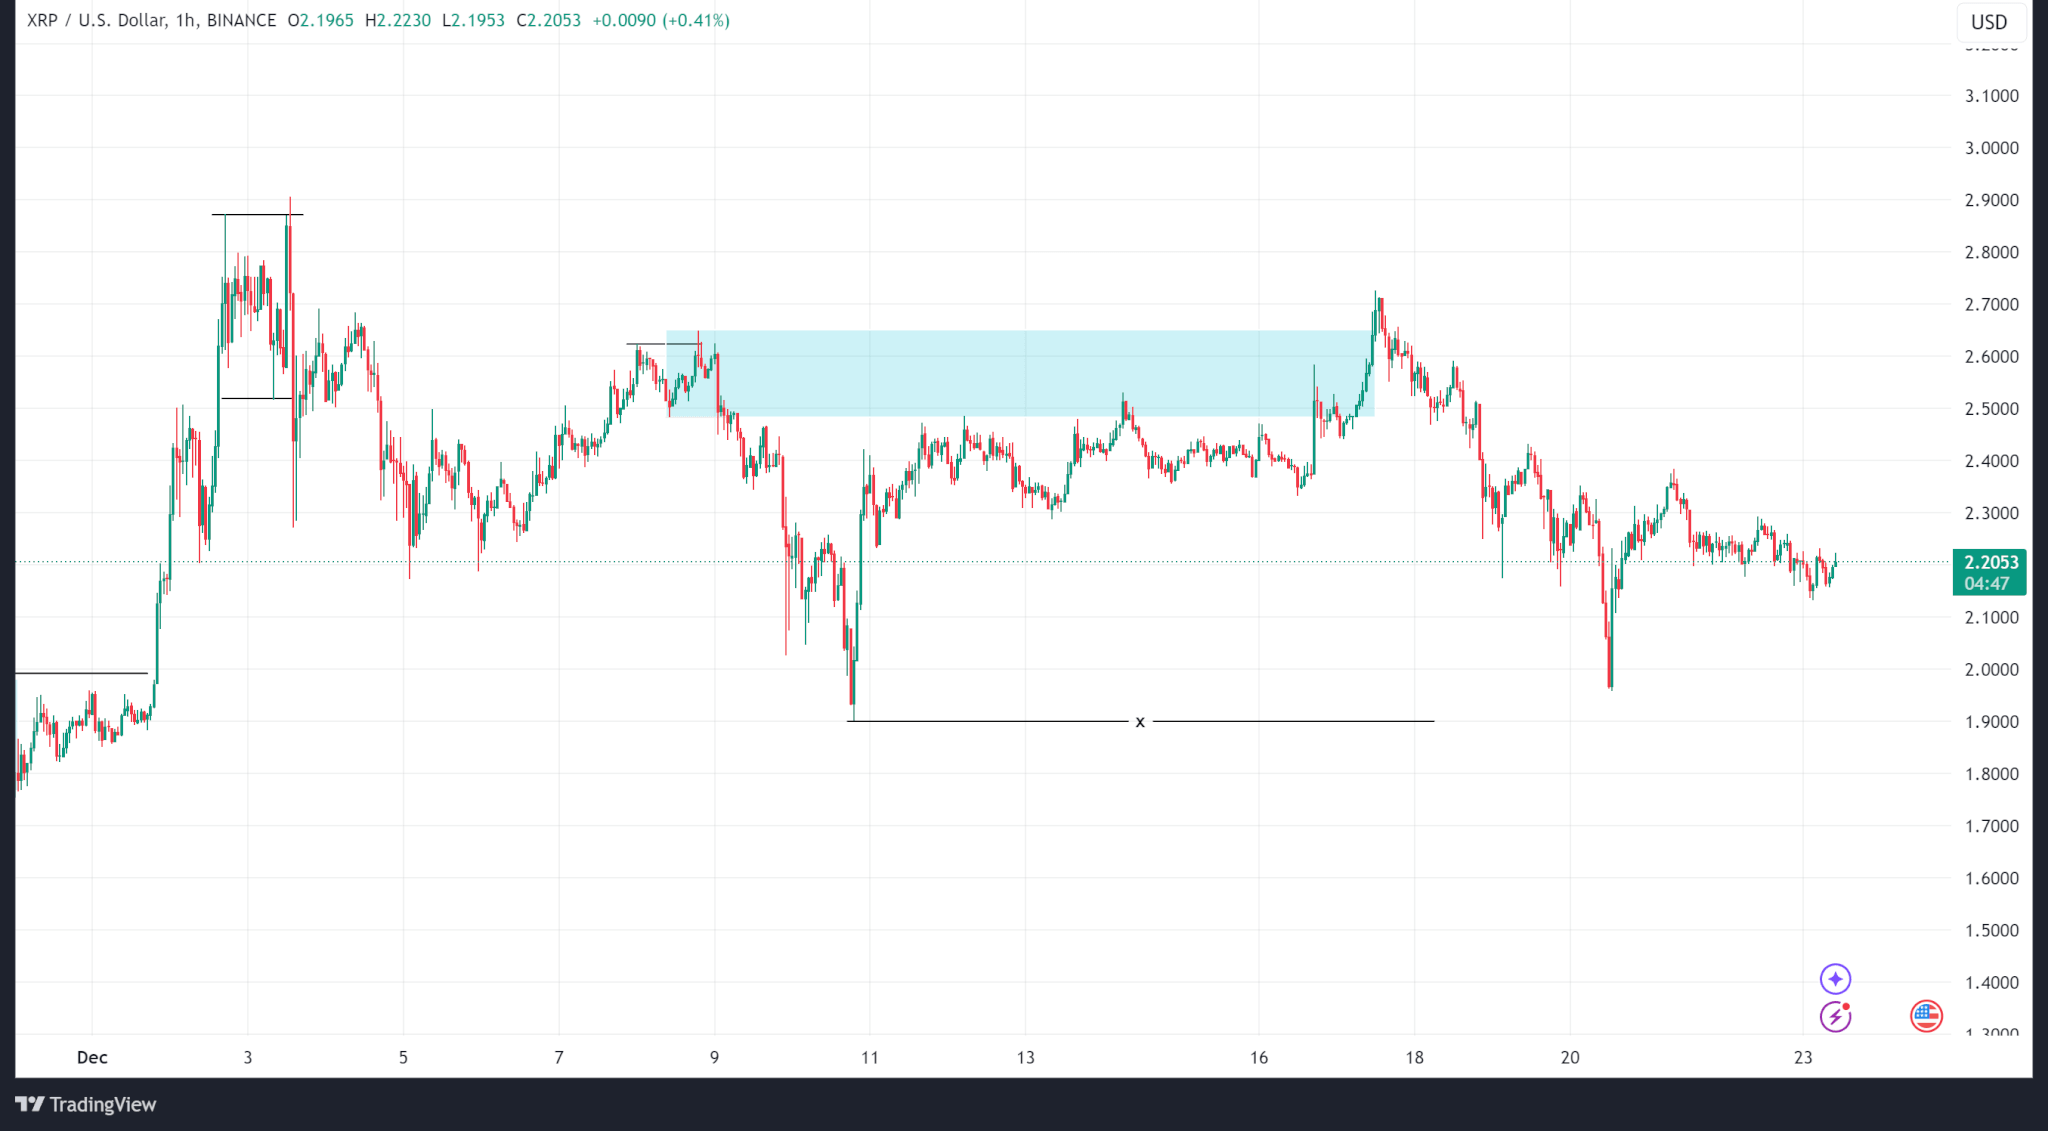
Since breaking previous all-time highs two weeks ago, Ripple’s price action has largely ranged between $1.89 and $2.90. However, within this range, the price has logged lower lows.
Ripple’s price traded into an internal supply zone and broke above it on Dec. 17 but melted to a weekly low of $1.95 before eventually closing at $2.27 (a 16.42% drop).
Ripple’s open interest data shows a decline in open contracts since Dec. 3.
Ripple trades at $2.21 as of publishing.


